Saildrone USVs have completed a series of missions to test the platform as part of the Tropical Pacific Observation System monitoring El Niño weather events in the Pacific Ocean.
Autonomous Vehicles Will Be Integral to the Future of Tropical Pacific Observations

TAO buoy operations in the Pacific Ocean near the Equator off the NOAA Ship Ka'imimoana. Lieutenant Commander Matthew Wingate NOAA Corps/NOAA's National Weather Service (NWS) Collection.
Published on
July 9, 2019
Read time:
5
Minutes
The Tropical Pacific Observation System was developed to monitor oceanographic and meteorological conditions in the region to improve early predictions of major weather events like El Niño and La Niña, which are critical for emergency management and economic planning. The network combines a variety of observation platforms including ship-based surveys, satellites, and a grid of buoys moored to the bottom of the Pacific Ocean to provide the data required to understand environmental phenomena and develop essential global weather forecasts.
The TPOS 2020 project was initiated by the National Oceanic and Atmospheric Administration (NOAA) and 13 science organizations from six countries to redesign the Tropical Pacific Observing System by the year 2020. The cost and complications of maintaining the existing system prompted NOAA and its partners to look for a new tool to maintain and ultimately improve the quality of data.
San Francisco’s CBS affiliate KPIX 5 covered the Mission 1 deployment from Saildrone HQ.
In September 2017, Saildrone partnered with NOAA to launch a series of six-month missions to the Tropical Pacific to test how unmanned surface vehicles (USVs) could augment TPOS data collection and improve long-term weather forecasting.
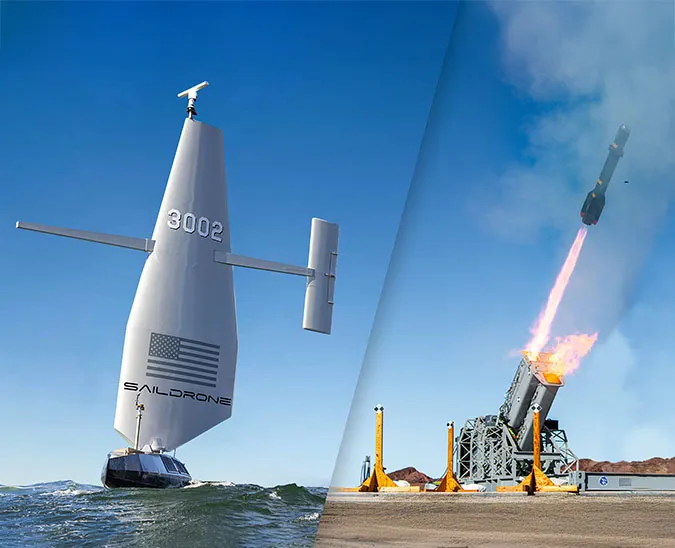
Saildrone’s wind and solar-powered USVs are designed for long-range data collection in the toughest ocean environments and carry a suite of science sensors to collect a variety of in situ meteorological and oceanographic measurements including sea surface temperature, air temperature, wind speed and direction, atmospheric pressure, ocean currents, and air-sea gas flux. These measurements are integral to understanding and predicting major weather events.
How changes in the ocean affect people on land
El Niño is most readily associated with particularly snowy winters in the Sierra Nevada and Rocky Mountains, but this complex weather pattern and its antithesis La Niña impact weather patterns and climate on both sides of the Pacific, and indeed, around the world, leading to coastal flooding, droughts and wildfires, and shifts in fish stocks that affect the larger ocean ecosystem.
These two events are opposite phases of the El Niño-Southern Oscillation (ENSO), a fluctuation in sea surface temperature (SST) in the Equatorial Pacific and the most influential climate phenomena on Earth.
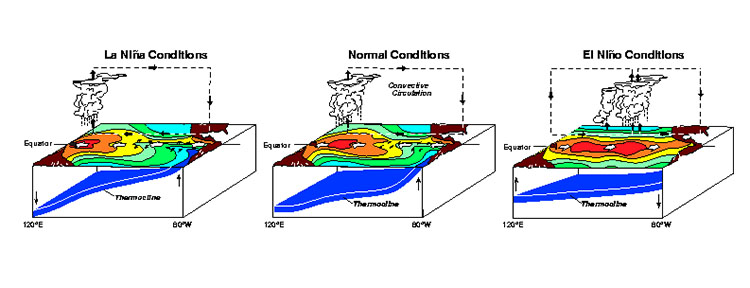
Every three to seven years, sea surface temperatures in the Central and Eastern Tropical Pacific warm or cool 1°C to 3°C from normal. Warmer waters create El Niño conditions: Rainfall decreases over Indonesia and Australia and increases precipitation over North America and South America. Cooler waters create La Niña conditions: Rainfall increases over Asia and the Americas experience drier weather. In general, the more significant the temperature change, the stronger the El Niño or La Niña event.
Saildrones in the Tropics
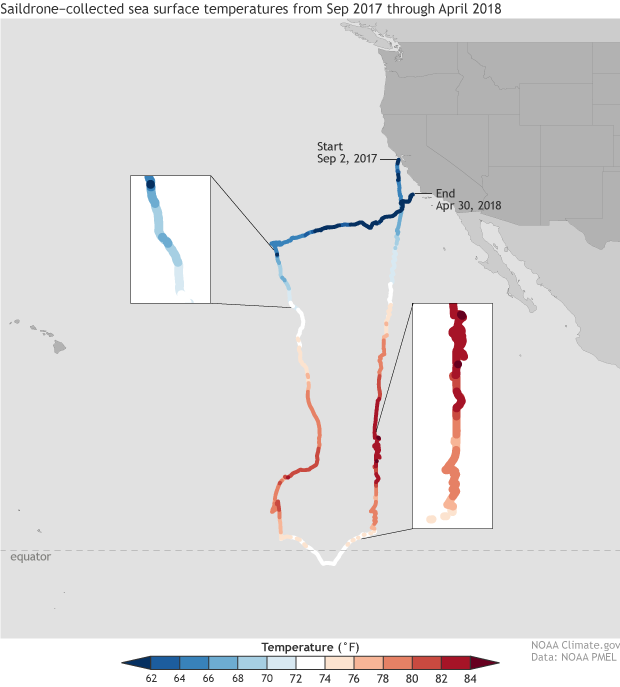
The first Saildrone/TPOS mission launched two USVs from Saildrone HQ in Alameda, CA, to sail southwest toward the equator. SD 1005 and SD 1006 rendezvoused with the RV Roger Revelle in the SPURS-2 field study region in the North Pacific Intertropical Convergence Zone (ITCZ) mid-October to validate collected measurements. While in the survey area, the saildrones sailed patterns around moored buoys to provide spatial and temporal gradient information as well as validate buoy sensors. The two saildrones sailed a combined 16,600 nautical miles over the course of the mission.
The preliminary data revealed findings regarding sea surface temperature shifts previously undetectable by satellite or buoy. “We are surprised by how abrupt these fronts are. Some of these warm water fronts are so sharp that the ocean is changing a whole degree in temperature over less than a kilometer,” said Meghan Cronin, an oceanographer at NOAA’s Pacific Marine Environmental Laboratory (PMEL).
The second mission deployed a fleet of four saildrones from Keehi Marine Center in Honolulu, HI. Pre-mission testing took place near a PMEL carbon buoy outside of Kaneohe Bay on the east side of Oahu. From Oahu, the saildrones headed south toward the Equator, stopping to sail a box pattern around a Tropical Atmosphere Ocean (TAO) mooring along the way.
Due to light winds and strong currents, the saildrones ran into issues with biofouling as they approached the Equatorial Pacific and the saildrones had to be rerouted to return to Hawaii. As they sailed north into cooler waters, all the barnacles fell off. Onshore, the saildrone hulls were coated with a copper-based paint designed to limit biofouling. They were redeployed in March and are performing as expected.
“The ocean is an unforgivable environment, and each region presents particular challenges to maritime travel. Biofouling is an issue with any vehicle traveling in the tropics. Saildrones are wind-powered. When wind speeds decrease as they do near the Equator, so does vehicle speed, increasing the rate of growth,” explained Saildrone founder and CEO Richard Jenkins. “The new copper bottom paint is formulated to impede marine growth. The saildrones have been back in the water for over two months and are performing very well, so far unimpeded by any biofouling.”
Three saildrones were deployed from Guam in late 2018 to collect data in the Western Equatorial Pacific and collect surface ocean and meteorological measurements in the Kuroshio Surface Current, a western boundary current similar to the Gulf Stream in the Atlantic Ocean.
TPOS 2020 reports
The TPOS 2020 First Report discussed emerging uses for several autonomous platforms including Saildrone USVs, as well as surface and subsurface gliders, profiling floats, and satellites. These unmanned systems represent a new observational stack to improve our understanding of weather phenomenons like El Niño, which will have a positive global impact.
The TPOS 2020 Second Report details further testing and trials regarding the potential uses of these and other unmanned platforms that took place since the First Report, noting that Saildrone USVs “appear to be a promising platform for monitoring air-sea interaction, fronts, and evolving surface features.”
A comprehensive, long-term monitoring system must be comprised of all available technologies, including satellites, moored buoys, floats, and surface vehicles. Saildrone USVs are a nimble, durable, environmentally-friendly, and affordable component of the future TPOS network.
Must Read


[
NEVER MISS AN UPDATE
]
Stay informed with the latest research findings and updates.
By clicking Sign Up you're confirming that you agree with our Privacy Policy.