Antarctica in the Classroom
Science, Technology, Engineering & Math Curriculum
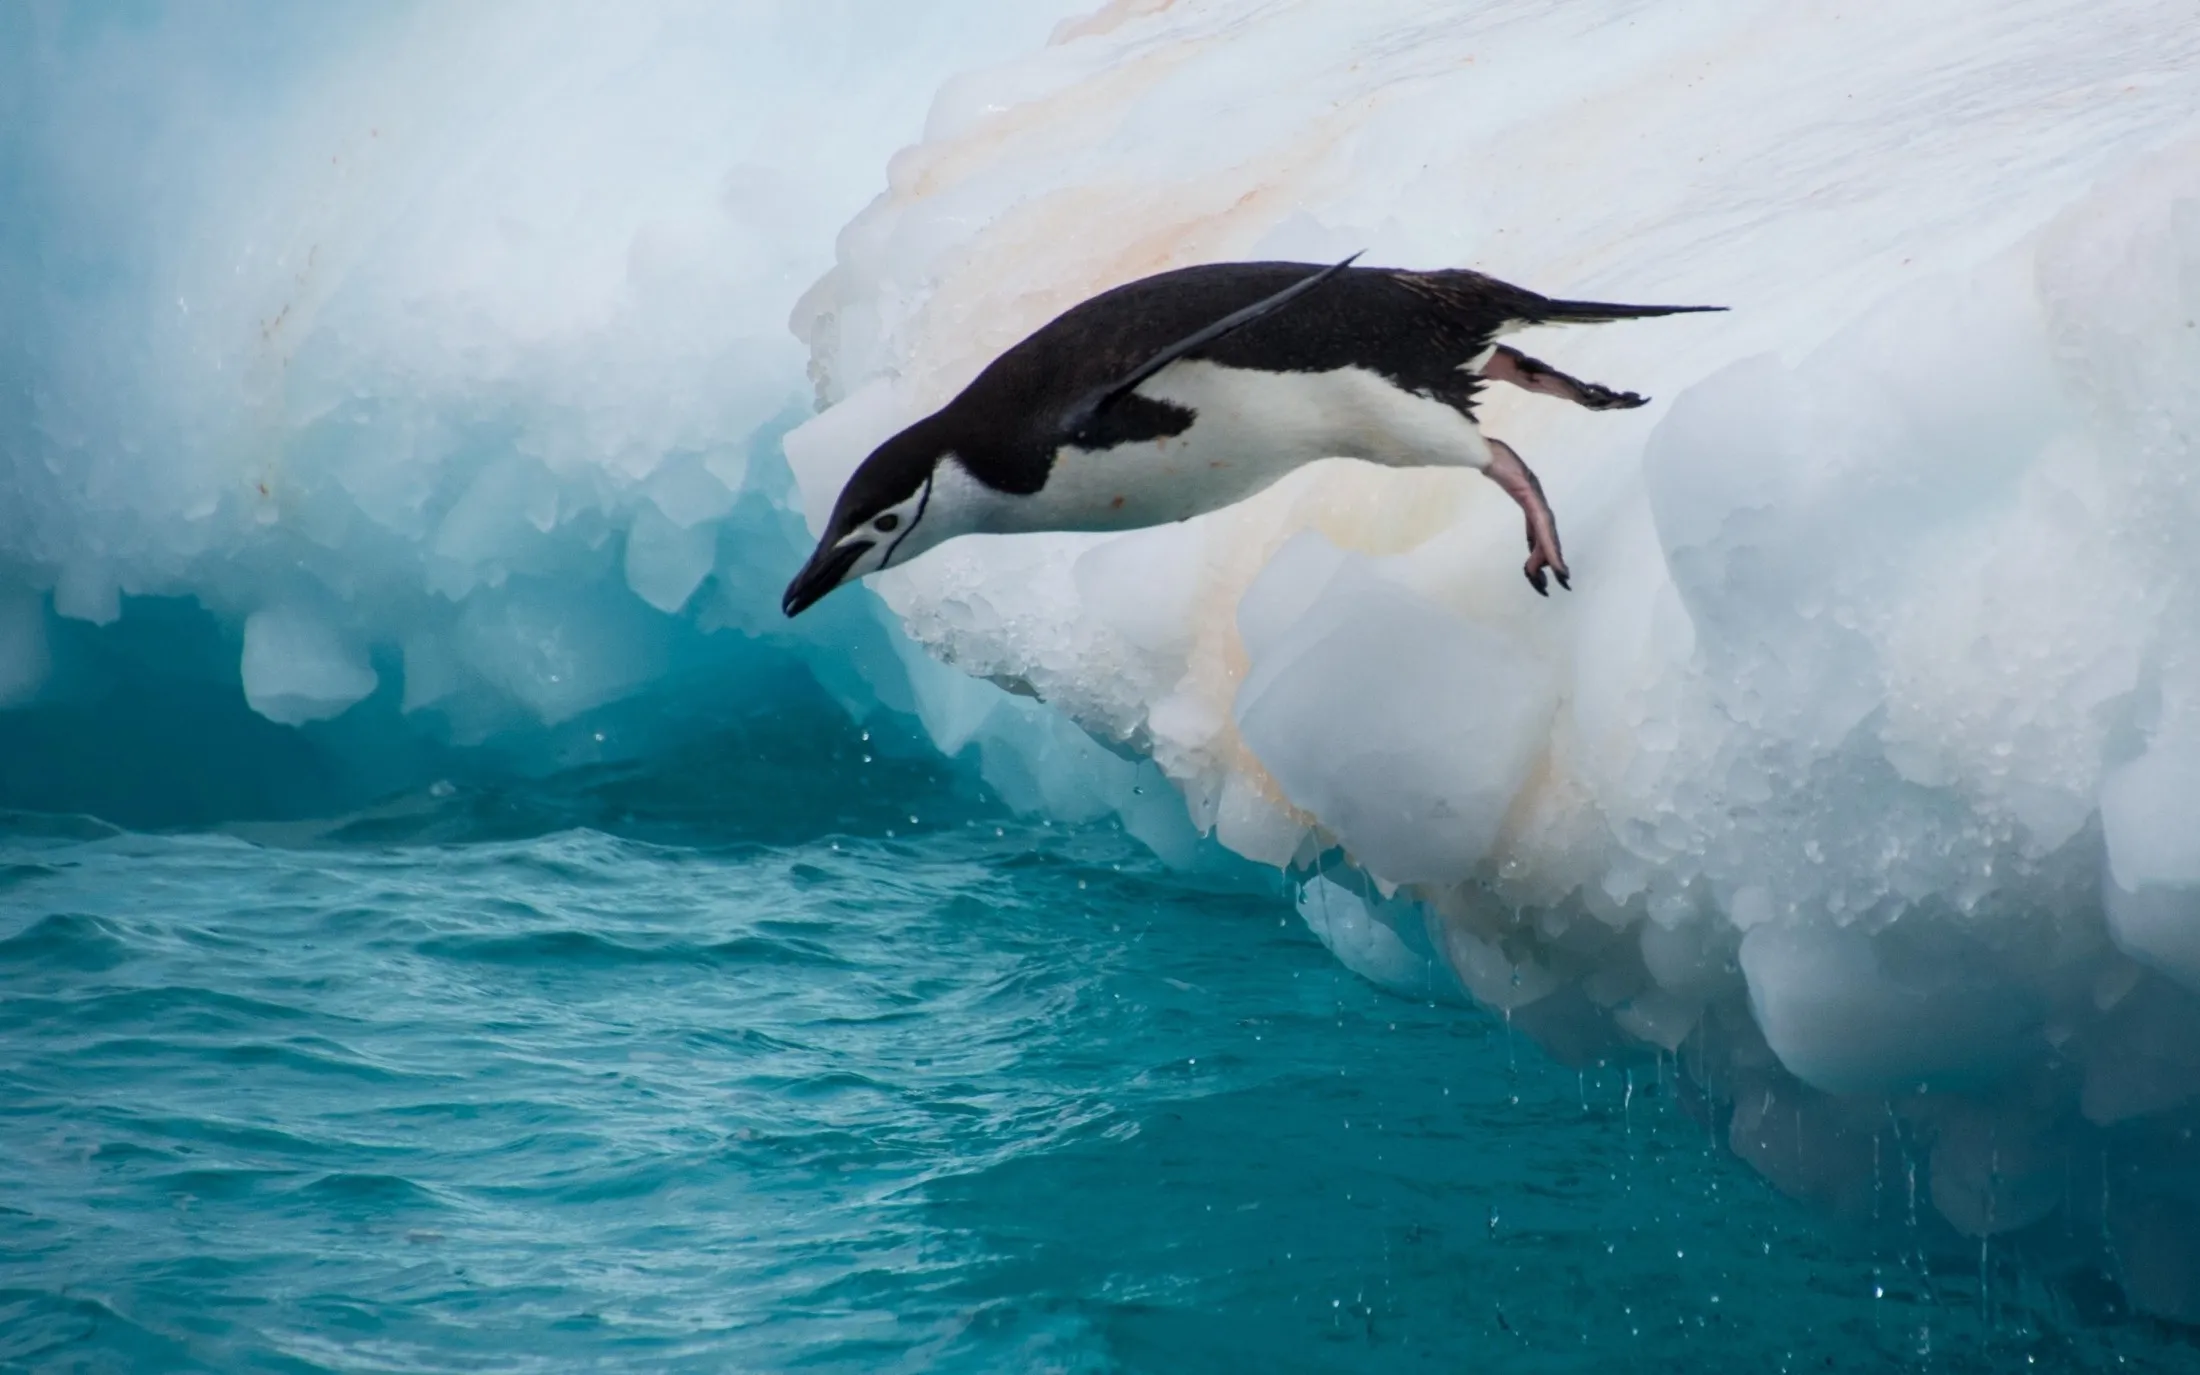
Module 3 - Penguins & Statistics
Statistics is all about the collection, analysis, interpretation, and presentation of data, and it plays a key role in the study of our environment. Scientists use statistics to look for patterns, make connections, and identify areas of concern.
Saildrones make it possible to collect the data that scientists need to monitor climate change by studying tagged penguins and the areas where they feed and analyzing the relationship between predators and their prey (eg. fish and krill).
Lesson 1
Learning Objectives
Know the importance of the data handling cycle when planning an investigation
Identify a good hypothesis
Explain the different types of data representation
Analyze different forms of data representation
Resources
Lesson 2
Learning Objectives
Know and calculate the mean, mode and median
Know and calculate range
Resources
Lesson 3
Learning Objectives
Know how to select and present data
Know how to interpret, analyze and present data accurately
Resources