
Thank you! Your submission has been received!
Oops! Something went wrong while submitting the form.
 Technology
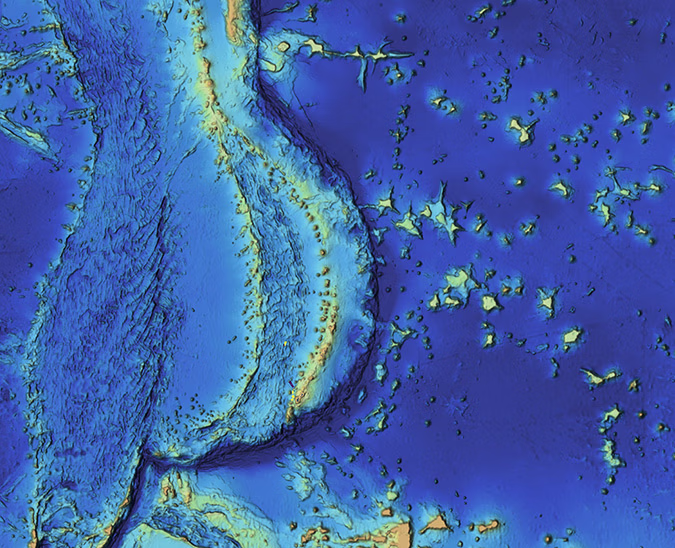
Autonomous USVs Can Help Secure the GIUK Gap
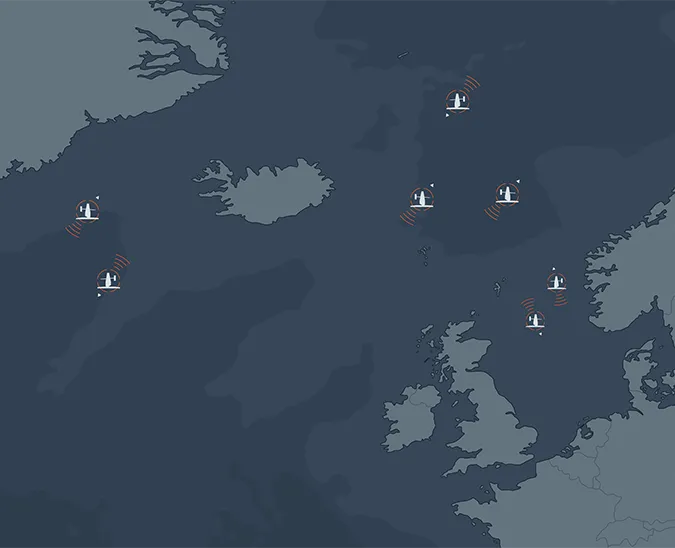
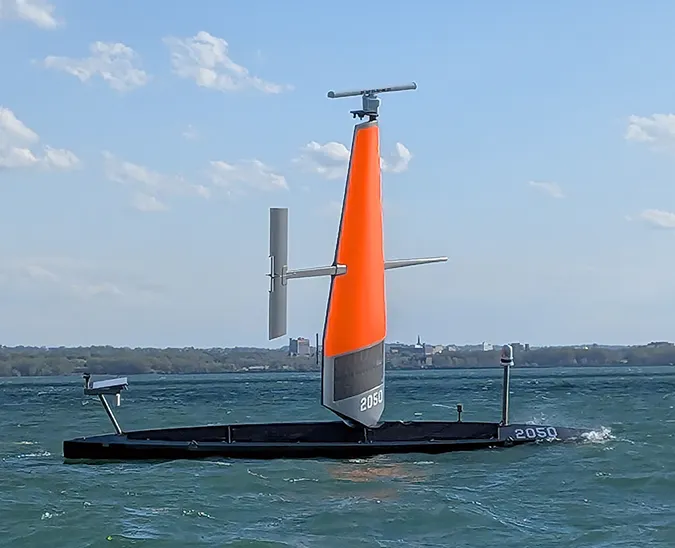
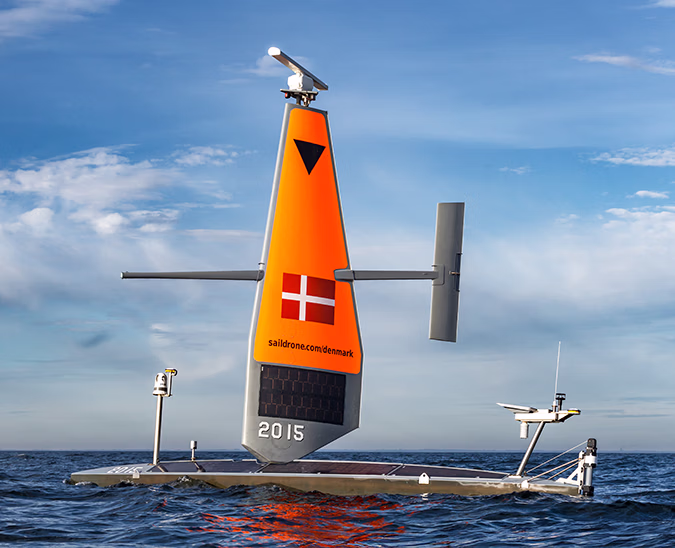
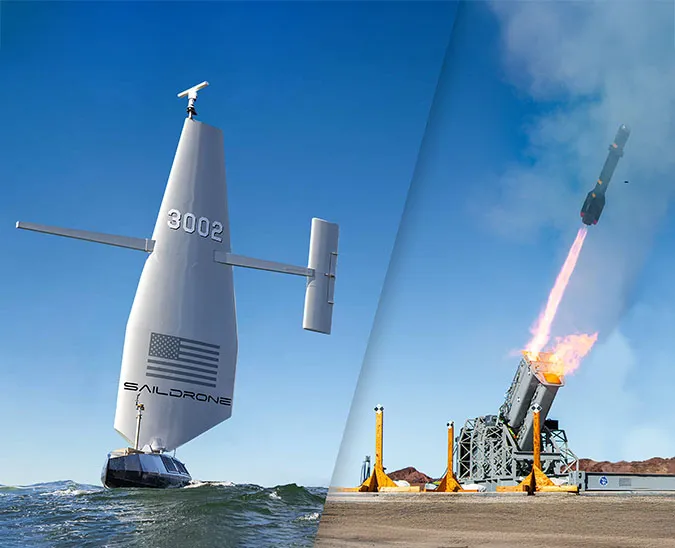
As Arctic sea lanes become more navigable and subsurface activity increases across the High North, naval forces need persistent, scalable ASW capabilities. Saildrone Spectre is designed to extend autonomous surveillance across strategic chokepoints where endurance matters most.
Technology


Never Miss an Update
Stay informed with the latest research findings and updates.
Thank you! Your submission has been received!
Oops! Something went wrong while submitting the form.