Published on
Author
Over the past year, Saildrone unmanned surface vehicles (USVs) have completed the first autonomous circumnavigation of Antarctica and the first eastbound and westbound crossing of the Atlantic Ocean by an unmanned vehicle. They have discovered a shipwreck in the Gulf of Mexico, tracked crustaceans in the Bering Sea, and surveyed fish in the North Sea, eddies off the coast of Africa, and air-sea heat transfer in the Gulf Stream. And—they have spent 147 days intentionally sailing up to, and sometimes into, bands of Arctic sea ice.
The Arctic ice cap is not stationary; it’s made up of sea ice floating on the surface of the Arctic Ocean. Arctic sea ice is typically two to three meters (6.5 feet – 10 feet) thick, and it grows, melts, and moves with the seasons. It is instrumental in moderating global weather and climate and presents a significant danger to shipping and fisheries vessels in the region.
The fifth annual Arctic mission, in partnership with the National Oceanic and Atmospheric Administration (NOAA) and the National Aeronautics and Space Administration (NASA), had several objectives: five saildrones collected observations close to sea ice to improve ice prediction and sea surface temperature (SST) observations for satellite algorithm development and studied air-sea carbon interactions in the Chukchi Sea. A sixth saildrone conducted a fisheries mission in the Bering Sea.
The fleet traveled more than 36,000 nautical miles (66,672 kilometers) and set a new Saildrone northern latitude record of 75.49°N.
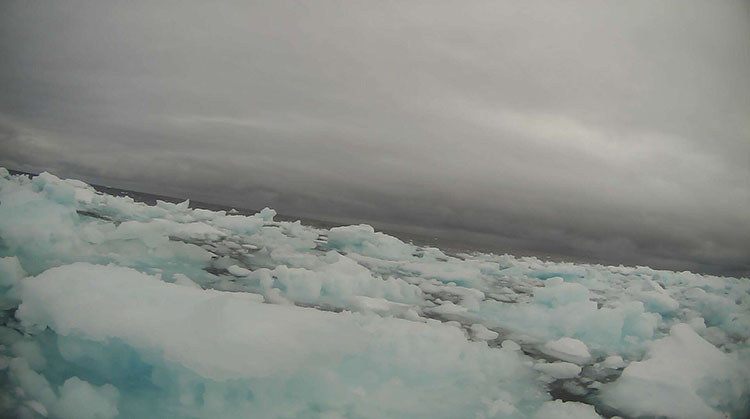
“This mission was very interesting, challenging, time consuming, and rewarding. It felt like true exploration. Nobody had done this before. Each day brought its own intensive process of evaluating risk and reward. When we finally got close to the ice, we made observations that we’re hard-pressed to find elsewhere,” said Dr. Andy Chiodi, a researcher at the University of Washington’s Joint Institute for the Study of Atmosphere and Ocean, a NOAA Cooperative Institute, and one of two science-side mission managers.
There are a number of challenges to predicting sea ice: understanding the variability in ice dynamics and physics, representing those variables as a numerical prediction model, and having good in situ observations to help initiate predictions, also called initial conditions.
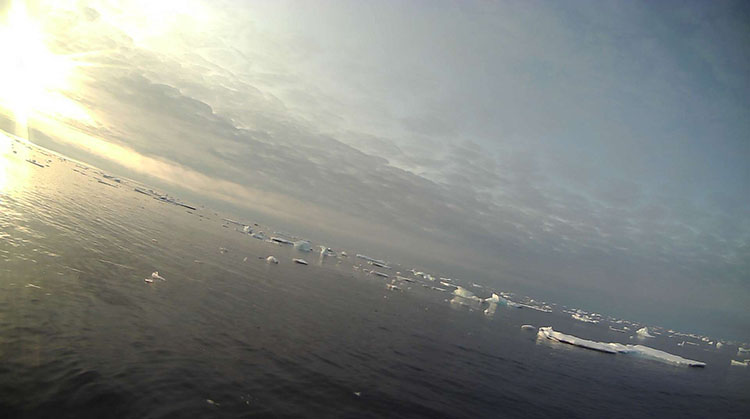
In terms of mission management, the most critical question the team had to answer was how they would know when a saildrone was nearing the ice edge. While saildrone observations are relayed minute-by-minute in real time via satellite to Saildrone Mission Control, saildrones only transmit photographs every hour, too long of a delay for a visual indication of approaching ice in this highly unpredictable region.
“Predicting Arctic sea ice is a challenge. The conventional wisdom is that you need ice information like ice thickness in order to predict Arctic ice, but people are so focused on the ice, they overlook the environmental information. A saildrone cannot measure ice, but a saildrone can measure the ice environment,” said Dr. Chidong Zhang, an oceanographer at NOAA’s Pacific Marine Environmental Laboratory (PMEL) leading the mission to enhance sea ice prediction.
Saildrone USVs are equipped with a standard suite of science sensors to measure a variety of environmental conditions above and below the sea surface including air and sea temperature, wind speed and direction, salinity, dissolved oxygen, chlorophyll-a, air pressure, radiation, and humidity. From these measured variables, surface net heat fluxes can be estimated, which vary more substantially in the Arctic than in other oceans.
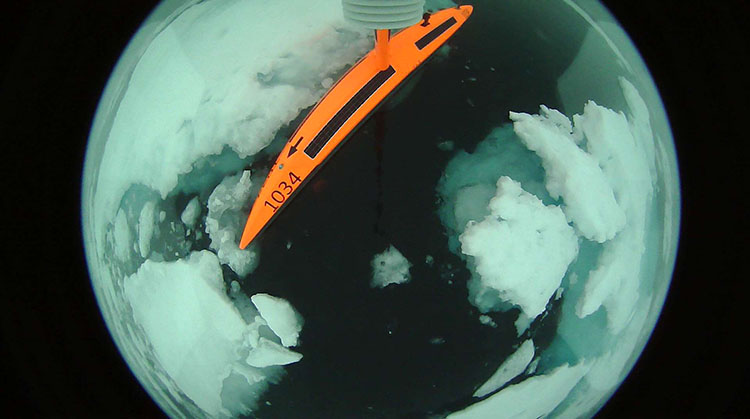
It was hypothesized that salinity and temperature could be indicators of approaching ice—that close to the ice there would be a drop in salinity (due to ice melt, which is pure water) and temperature. However, salinity and temperature gradients were sharper than anticipated, and their detection for use as an indicator of ice was dependent on the direction of winds and currents relative to how the vehicle was approaching the ice. Which means that on several occasions the saildrones sailed not only up to but into the ice, transmitting back unbelievable “saildrone selfies” of the vehicles surrounded by a vast field of blue-green Arctic ice.
Real-time comparisons of Saildrone data with numerical models provided by prediction centers—NOAA’s National Weather Service, the US Navy’s Fleet Weather Center, Environment Canada, the UK’s Met Office, and the European Centre for Medium-Range Weather Forecasts (ECMWF)—revealed that surface net heat fluxes in the Arctic vary substantially, short-range numerical predictions can be very good for certain variables but not for others, and they deviate quickly from saildrone in-situ observations as the prediction range increases.
Global weather forecasting maps are generated by a variety of satellites, which measure Earth’s radiation from space. Those radiation measurements are transformed into sea surface temperature with an algorithm, which is developed using observations from drifting and moored buoys, however, there are very few observations in the Arctic because moored buoys would be destroyed by the moving sea ice. Limited in-situ observations have been made by research vessels and ice breakers.
“The algorithm is naturally biased to where data is sampled. If you’re not regularly sampling in the Arctic, then your algorithm’s uncertainty will be larger there,” explained Dr. Chelle Gentemann, a senior scientist at The Farallon Institute. “The goal of this campaign was to collect more SST observations in the Arctic specifically for satellite SST algorithm development, and also to take observations in the marginal ice zone to understand how the ocean temperature is changing as we approach the ice edge.”
Saildrones typically measure water temperature a half-meter below the surface called the “bulk temperature”, which is the same as what most drifting buoys measure. But because the atmosphere is slightly cooler than the ocean, there is a very fine temperature gradient right at the surface, within one millimeter (.039 inches), called the “skin” temperature, which is what satellites measure.
Two saildrones carried an IR pyrometer mounted on the bow, known colloquially as “the unicorn” because of its horn-like shape. This unique sensor measures both the skin temperature and reflected sky radiation—a clear vs cloudy sky can affect skin temperature measurements.
“It’s not proven technology at this point, but if it’s determined to work, it will be revolutionary. Currently, we only have these observations from a couple of research vessels. If we can deploy this technology globally on a saildrone, it would completely change how we approach collecting in-situ data for algorithm development,” said Gentemann.
To develop an even finer understanding of near-surface temperature gradients, one saildrone had additional keel-mounted sensors to create a fine gradient temperature model—from the sea surface to the bottom of the keel, approximately 1.5 meters (4.9 feet) deep—to better understand diurnal (daily) warming. Understanding and modeling how the ocean heats and cools throughout the day and where these events occur are essential not only for calculating ocean temperature but also for understanding ocean and atmosphere interactions.
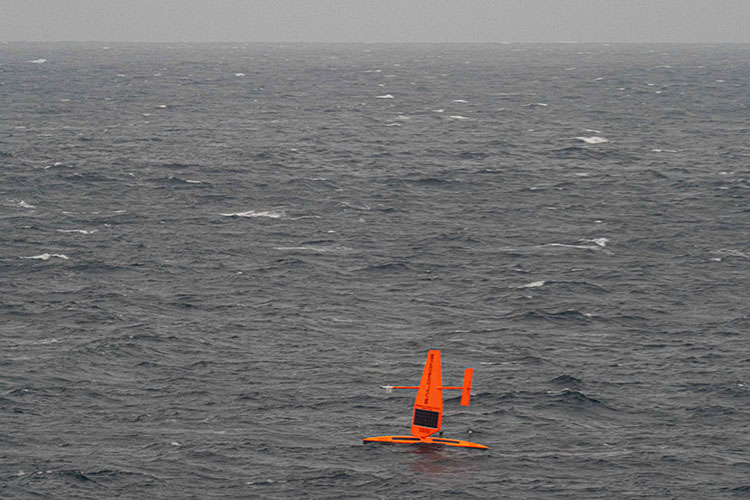
The Saildrone platform isn’t a single-use vehicle; the data they collect can be used to achieve several simultaneous research objectives. Two saildrones were also equipped with an ASVCO2 developed by NOAA/PMEL to measure air-sea carbon exchange. This is the third year in a row that saildrones have studied carbon absorption and ocean acidification in the Arctic region. Dr. Jessica Cross, an oceanographer at NOAA/PMEL, was studying how carbon dioxide concentrations close to the sea ice.
Cross was aboard the USCGC Healy for the annual ship-saildrone rendezvous. “It’s really fun to meet the saildrone out at sea. It’s like getting to wave hello to an old friend you only get to see once a year,” she said.
The sixth saildrone, equipped with an echo sounder, was dedicated to continuing fisheries research in the Bering Sea. Dr. Alex de Robertis, a fisheries biologist and Dr. Carey Kuhn, an ecologist, both with NOAA’s Alaska Fisheries Science Center, have led several Saildrone missions to survey walleye pollock and investigate the behavior of northern fur seals. The tags on the seals sent information to the saildrone so that it could follow a particular seal while the echo sounder captured information about the amount of walleye pollock in the water column. The seals were also tagged with cameras, which activated when the animal dove.
The ocean is an unruly place. Storms, gusty winds, powerful currents, massive breaking waves, icebergs, and sea ice abound. While Antarctic circumnavigation demonstrated the endurance of the Saildrone platform, sailing in and out of a sea of floating Arctic ice demonstrated its durability.
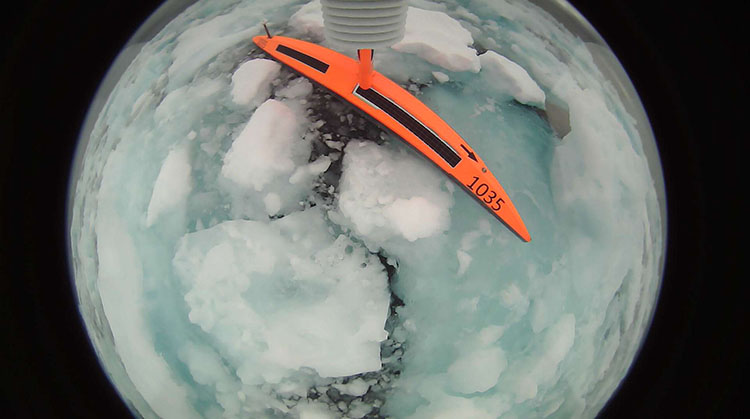
“We were surprised, given how many times we were stuck in ice, that the saildrones kept returning quality data. One sustained some damage at the very end [of the mission] but overall, they held up really well. It’s pretty impressive,” said Gentemann.
Resources
Follow the Saildrone 2019, NOAA Pacific Marine Environmental Laboratory, accessed December 11, 2019
Chelle L. Gentemann, Peter J. Minnett, et al., “2009. MISST: The Multi-Sensor Improved Sea Surface Temperature Project,” Oceanography 22(2):76–87
Multi-sensor Improved Sea Surface Temperature: Continuing the GHRSST Partnership and Arctic Data, National Oceanographic Partnership Program, accessed December 11, 2019


